|
|
||
|---|---|---|
| .github/workflows | ||
| cmd | ||
| db | ||
| documentation | ||
| environments | ||
| monitoring | ||
| pkg | ||
| scripts | ||
| test_config | ||
| version | ||
| .dockerignore | ||
| .gitignore | ||
| docker-compose.yml | ||
| Dockerfile | ||
| entrypoint.sh | ||
| go.mod | ||
| go.sum | ||
| LICENSE | ||
| main.go | ||
| Makefile | ||
| README.md | ||
ipld-eth-server
ipld-eth-server is the server backend for indexed ETH IPLD objects
Table of Contents
Background
NOTE: WIP
ipld-eth-server is used to service queries against the Ethereum IPLD objects indexed by ipld-eth-indexer.
It exposes standard Ethereum JSON RPC endpoints on top of the database, in some cases these endpoints can leverage the unique indexes to improve query performance. Additional, unique endpoints are exposed which utilize the new indexes and state diff data objects.
Dependencies
Minimal build dependencies
- Go (1.13)
- Git
- GCC compiler
- This repository
External dependency
- Postgres database populated by ipld-eth-indexer
Install
Start by downloading ipld-eth-server and moving into the repo:
GO111MODULE=off go get -d github.com/vulcanize/ipld-eth-server
cd $GOPATH/src/github.com/vulcanize/ipld-eth-server
Then, build the binary:
make build
Usage
After building the binary, run as
./ipld-eth-server serve --config=<the name of your config file.toml>
Configuration
Below is the set of parameters for the ipld-eth-server command, in .toml form, with the respective environmental variables commented to the side.
The corresponding CLI flags can be found with the ./ipld-eth-server serve --help command.
[database]
    name     = "vulcanize_public" # $DATABASE_NAME
    hostname = "localhost" # $DATABASE_HOSTNAME
    port     = 5432 # $DATABASE_PORT
    user     = "postgres" # $DATABASE_USER
    password = "" # $DATABASE_PASSWORD

[log]
    level = "info" # $LOGRUS_LEVEL

[server]
    ipcPath = "~/.vulcanize/vulcanize.ipc" # $SERVER_IPC_PATH
    wsPath = "127.0.0.1:8081" # $SERVER_WS_PATH
    httpPath = "127.0.0.1:8082" # $SERVER_HTTP_PATH
    graphql = true # $SERVER_GRAPHQL
    graphqlEndpoint = "" # $SERVER_GRAPHQL_ENDPOINT

[ethereum]
    chainID = "1" # $ETH_CHAIN_ID
    defaultSender = "" # $ETH_DEFAULT_SENDER_ADDR
    rpcGasCap = "1000000000000" # $ETH_RPC_GAS_CAP
    httpPath = "127.0.0.1:8545" # $ETH_HTTP_PATH
    nodeID = "arch1" # $ETH_NODE_ID
    clientName = "Geth" # $ETH_CLIENT_NAME
    genesisBlock = "0xd4e56740f876aef8c010b86a40d5f56745a118d0906a34e69aec8c0db1cb8fa3" # $ETH_GENESIS_BLOCK
    networkID = "1" # $ETH_NETWORK_ID
The database fields are for connecting to a Postgres database that has been/is being populated by ipld-eth-indexer
The server fields set the paths for exposing the ipld-eth-server endpoints
The ethereum fields set the chainID and default sender address to use for EVM simulation, and can optionally be used to configure a remote eth node to forward cache misses to
Endpoints
IPLD subscription
TODO: Port the IPLD RPC subscription endpoints after the decoupling
Ethereum JSON-RPC
ipld-eth-server currently recapitulates portions of the Ethereum JSON-RPC api standard.
The currently supported standard endpoints are:
eth_call
eth_getBalance
eth_getStorageAt
eth_getCode
eth_getProof
eth_blockNumber
eth_getHeaderByNumber
eth_getHeaderByHash
eth_getBlockByNumber
eth_getBlockByHash
eth_getTransactionCount
eth_getBlockTransactionCountByHash
eth_getBlockTransactionCountByNumber
eth_getTransactionByHash
eth_getRawTransactionByHash
eth_getTransactionByBlockHashAndIndex
eth_getTransactionByBlockNumberAndIndex
eth_getRawTransactionByBlockHashAndIndex
eth_getRawTransactionByBlockNumberAndIndex
eth_getTransactionReceipt
eth_getLogs
eth_getUncleCountByBlockHash
eth_getUncleCountByBlockNumber
eth_getUncleByBlockHashAndIndex
eth_getUncleByBlockNumberAndIndex
TODO: Add the rest of the standard endpoints and unique endpoints (e.g. getSlice)
Testing
make test will run the unit tests
make test setups a clean vulcanize_testing db
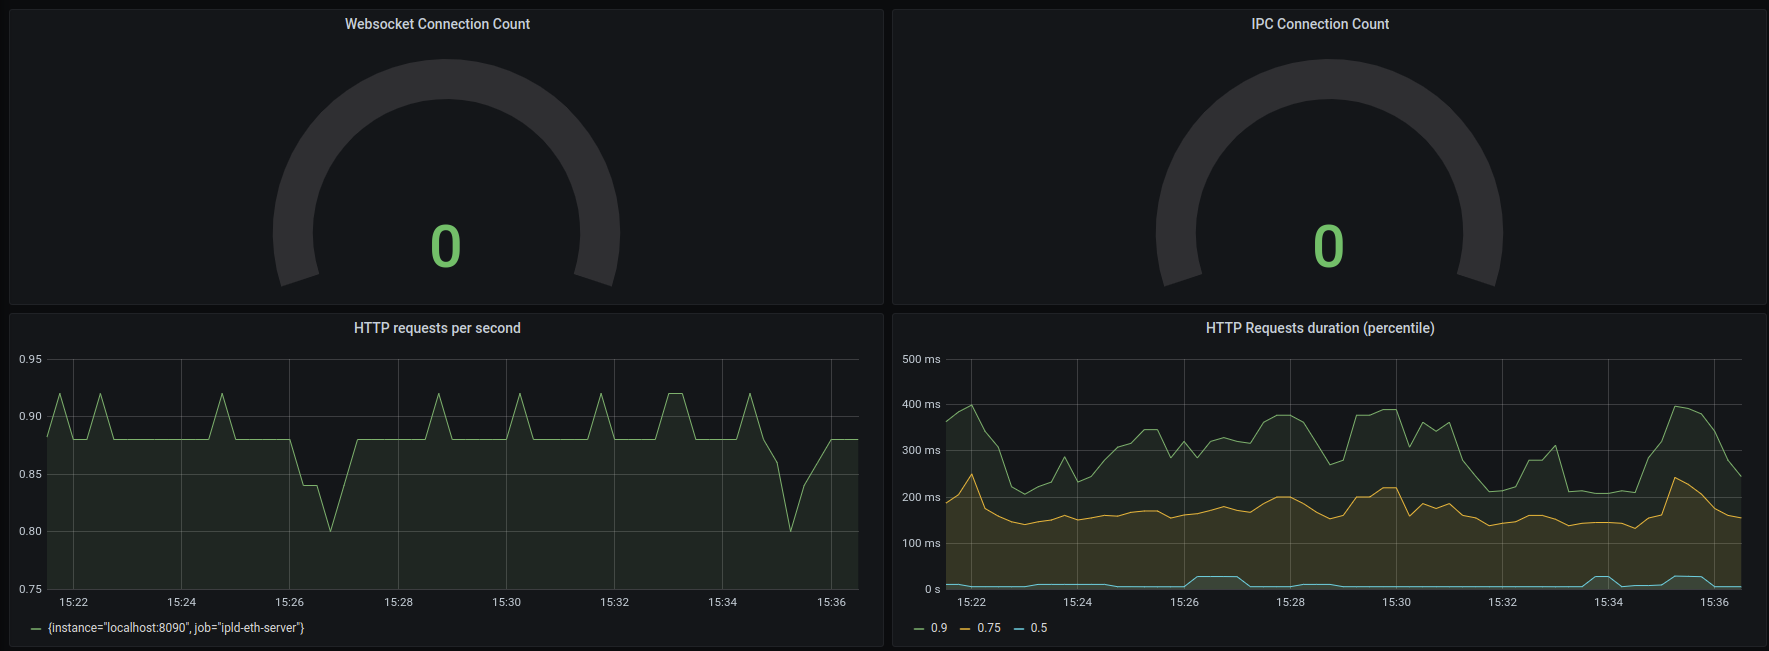
Monitoring
- Enable http server and metrics using parameters
--http --metrics - ipld-eth-server exposes prometheus metrics at
/metricendpoint - start prometheus using
monitoring/prometheus.ymlconfig (prometheus --config.file=monitoring/prometheus.yml) - start grafana, connect to prometheus datasource and import dashboard from
monitoring/grafana/dashboard_main.json
Contributing
Contributions are welcome!
VulcanizeDB follows the Contributor Covenant Code of Conduct.
License
AGPL-3.0 © Vulcanize Inc
